New - 3 Days Ago





Bedford and Amherst are neighboring Southern New Hampshire towns with different development patterns and current market profiles. This comparison focuses on housing, location, land-use context, utilities, and July 2026 single-family market data—not subjective neighborhood rankings.
| Topic | Bedford | Amherst |
|---|---|---|
| ZIP used for market snapshot | 03110 | 03031 |
| Single-family listings | 59 | 55 |
| Median asking price | $999,000 | $839,900 |
| Median days on market | 50 | 38 |
| Months of supply | 1.8 | 3.6 |
| Sale-to-original-list ratio | 99.5% | 102.1% |
Figures are as of July 31, 2026 and describe different pools of active and recently closed properties. They are not a prediction or a conclusion about which town offers better value.
Bedford adjoins Manchester and has direct access to Route 101, I-293, and the F.E. Everett Turnpike, with major services concentrated along South River Road. Amherst lies farther west, with travel commonly organized around Route 101, Route 101A, and connections toward Nashua, Milford, Bedford, and Manchester. Test the actual trip you expect to make.
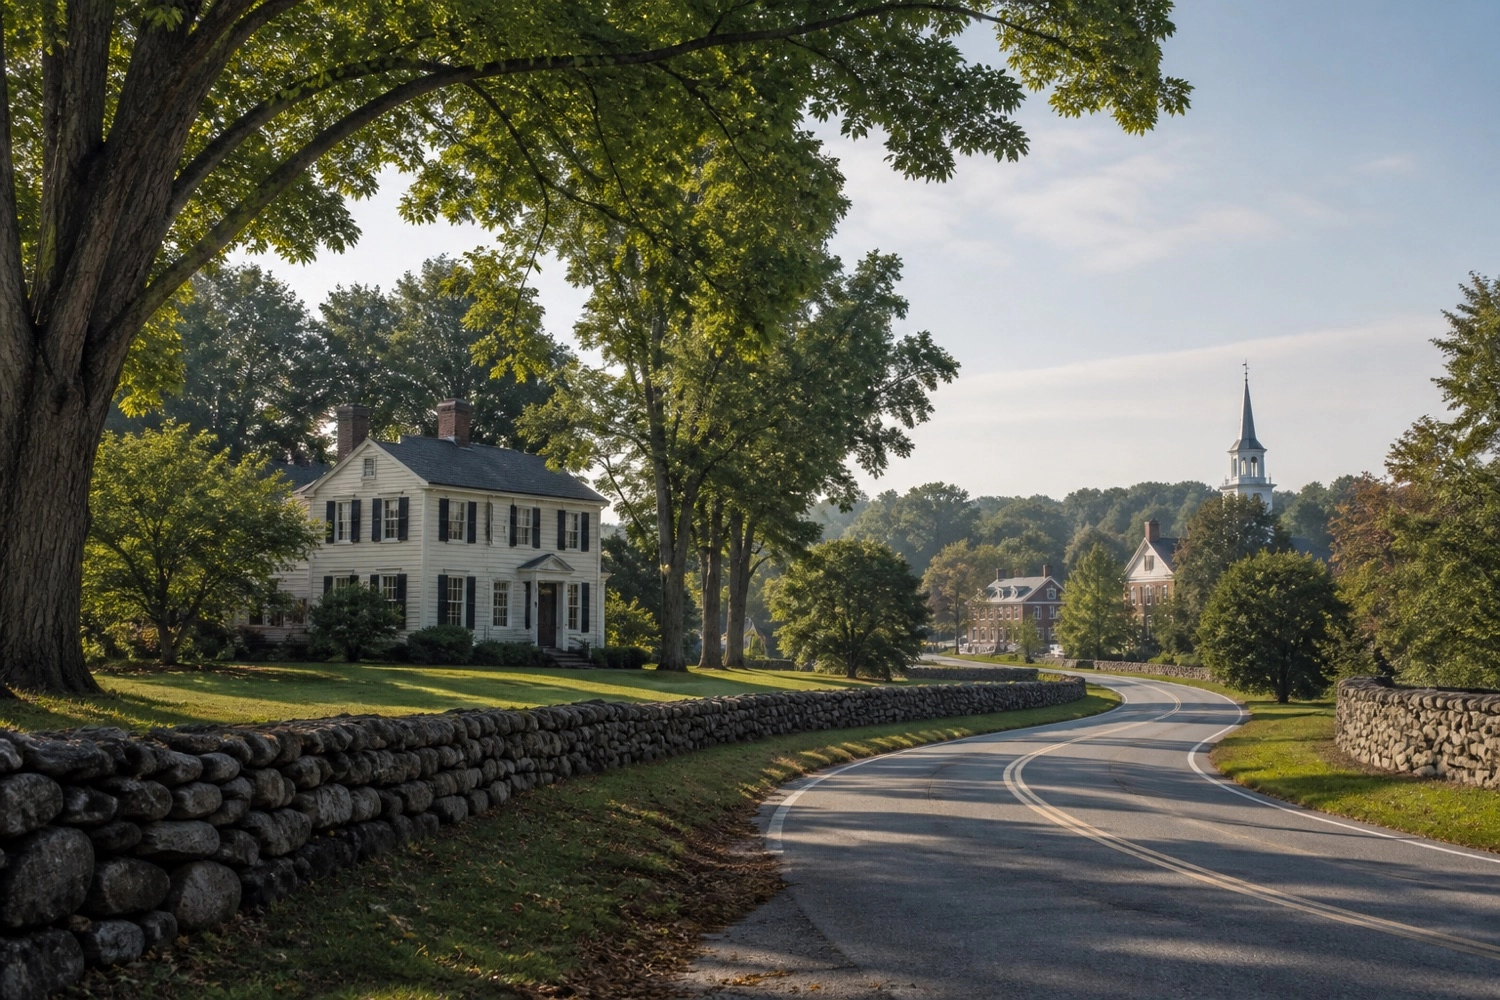
Bedford's master plan describes a predominantly single-family community with major commercial concentrations along South River Road and portions of Route 101. Amherst combines a historic village, established subdivisions, Baboosic Lake, rural residential roads, and the Route 101A commercial corridor. Both towns contain varied settings that cannot be reduced to a townwide label.
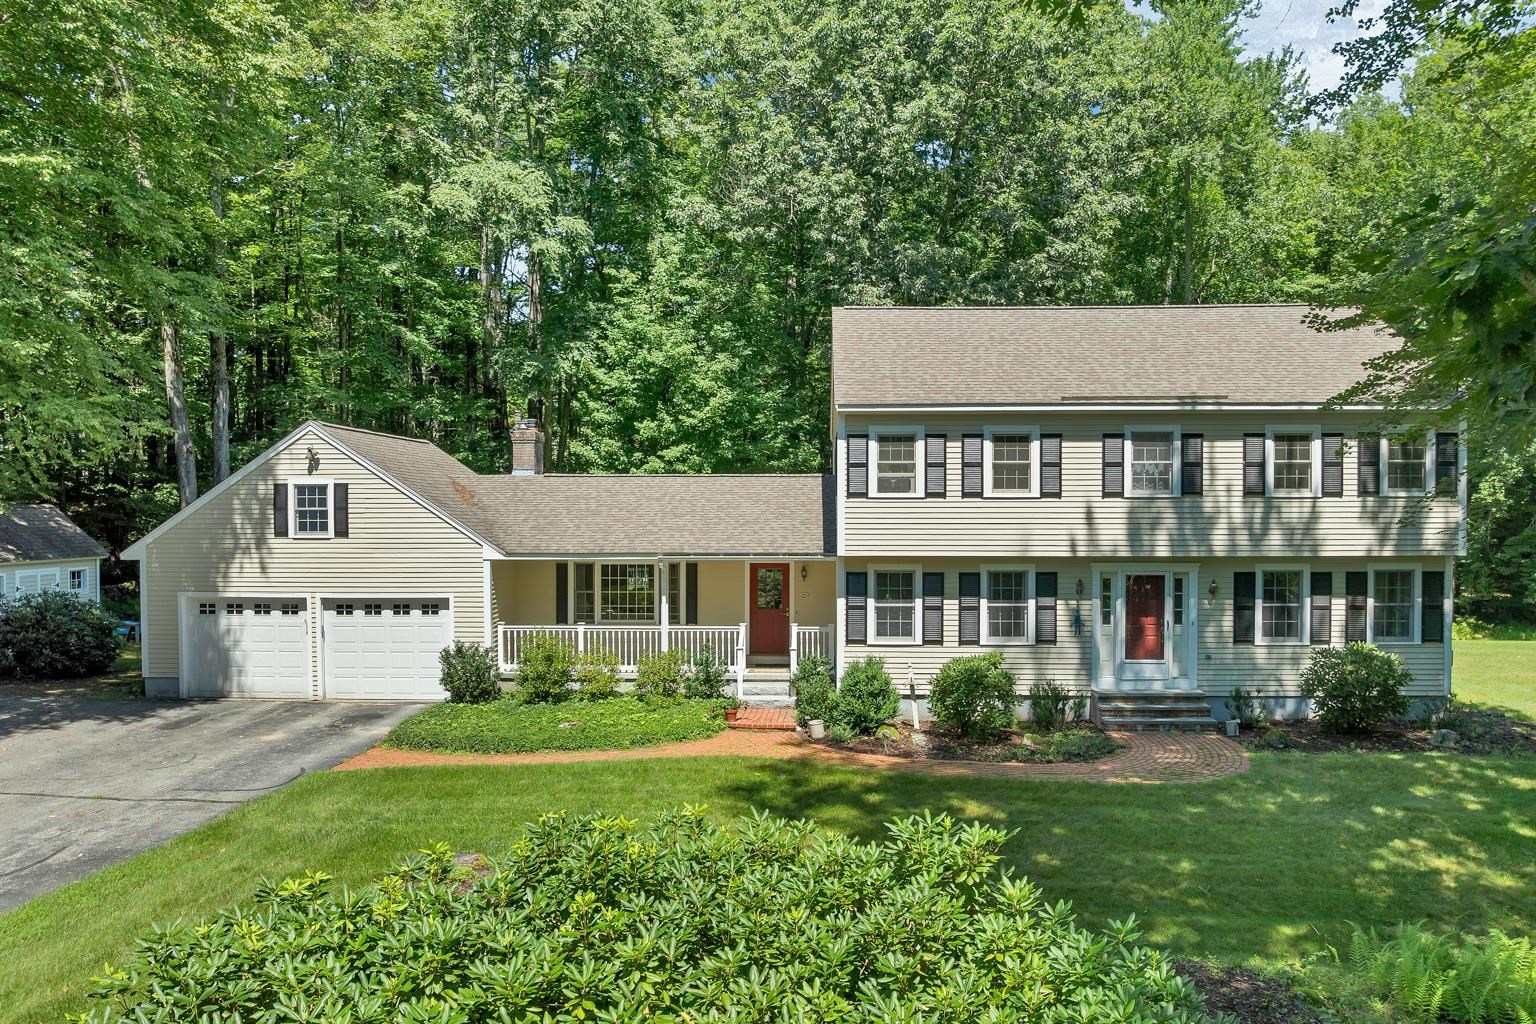
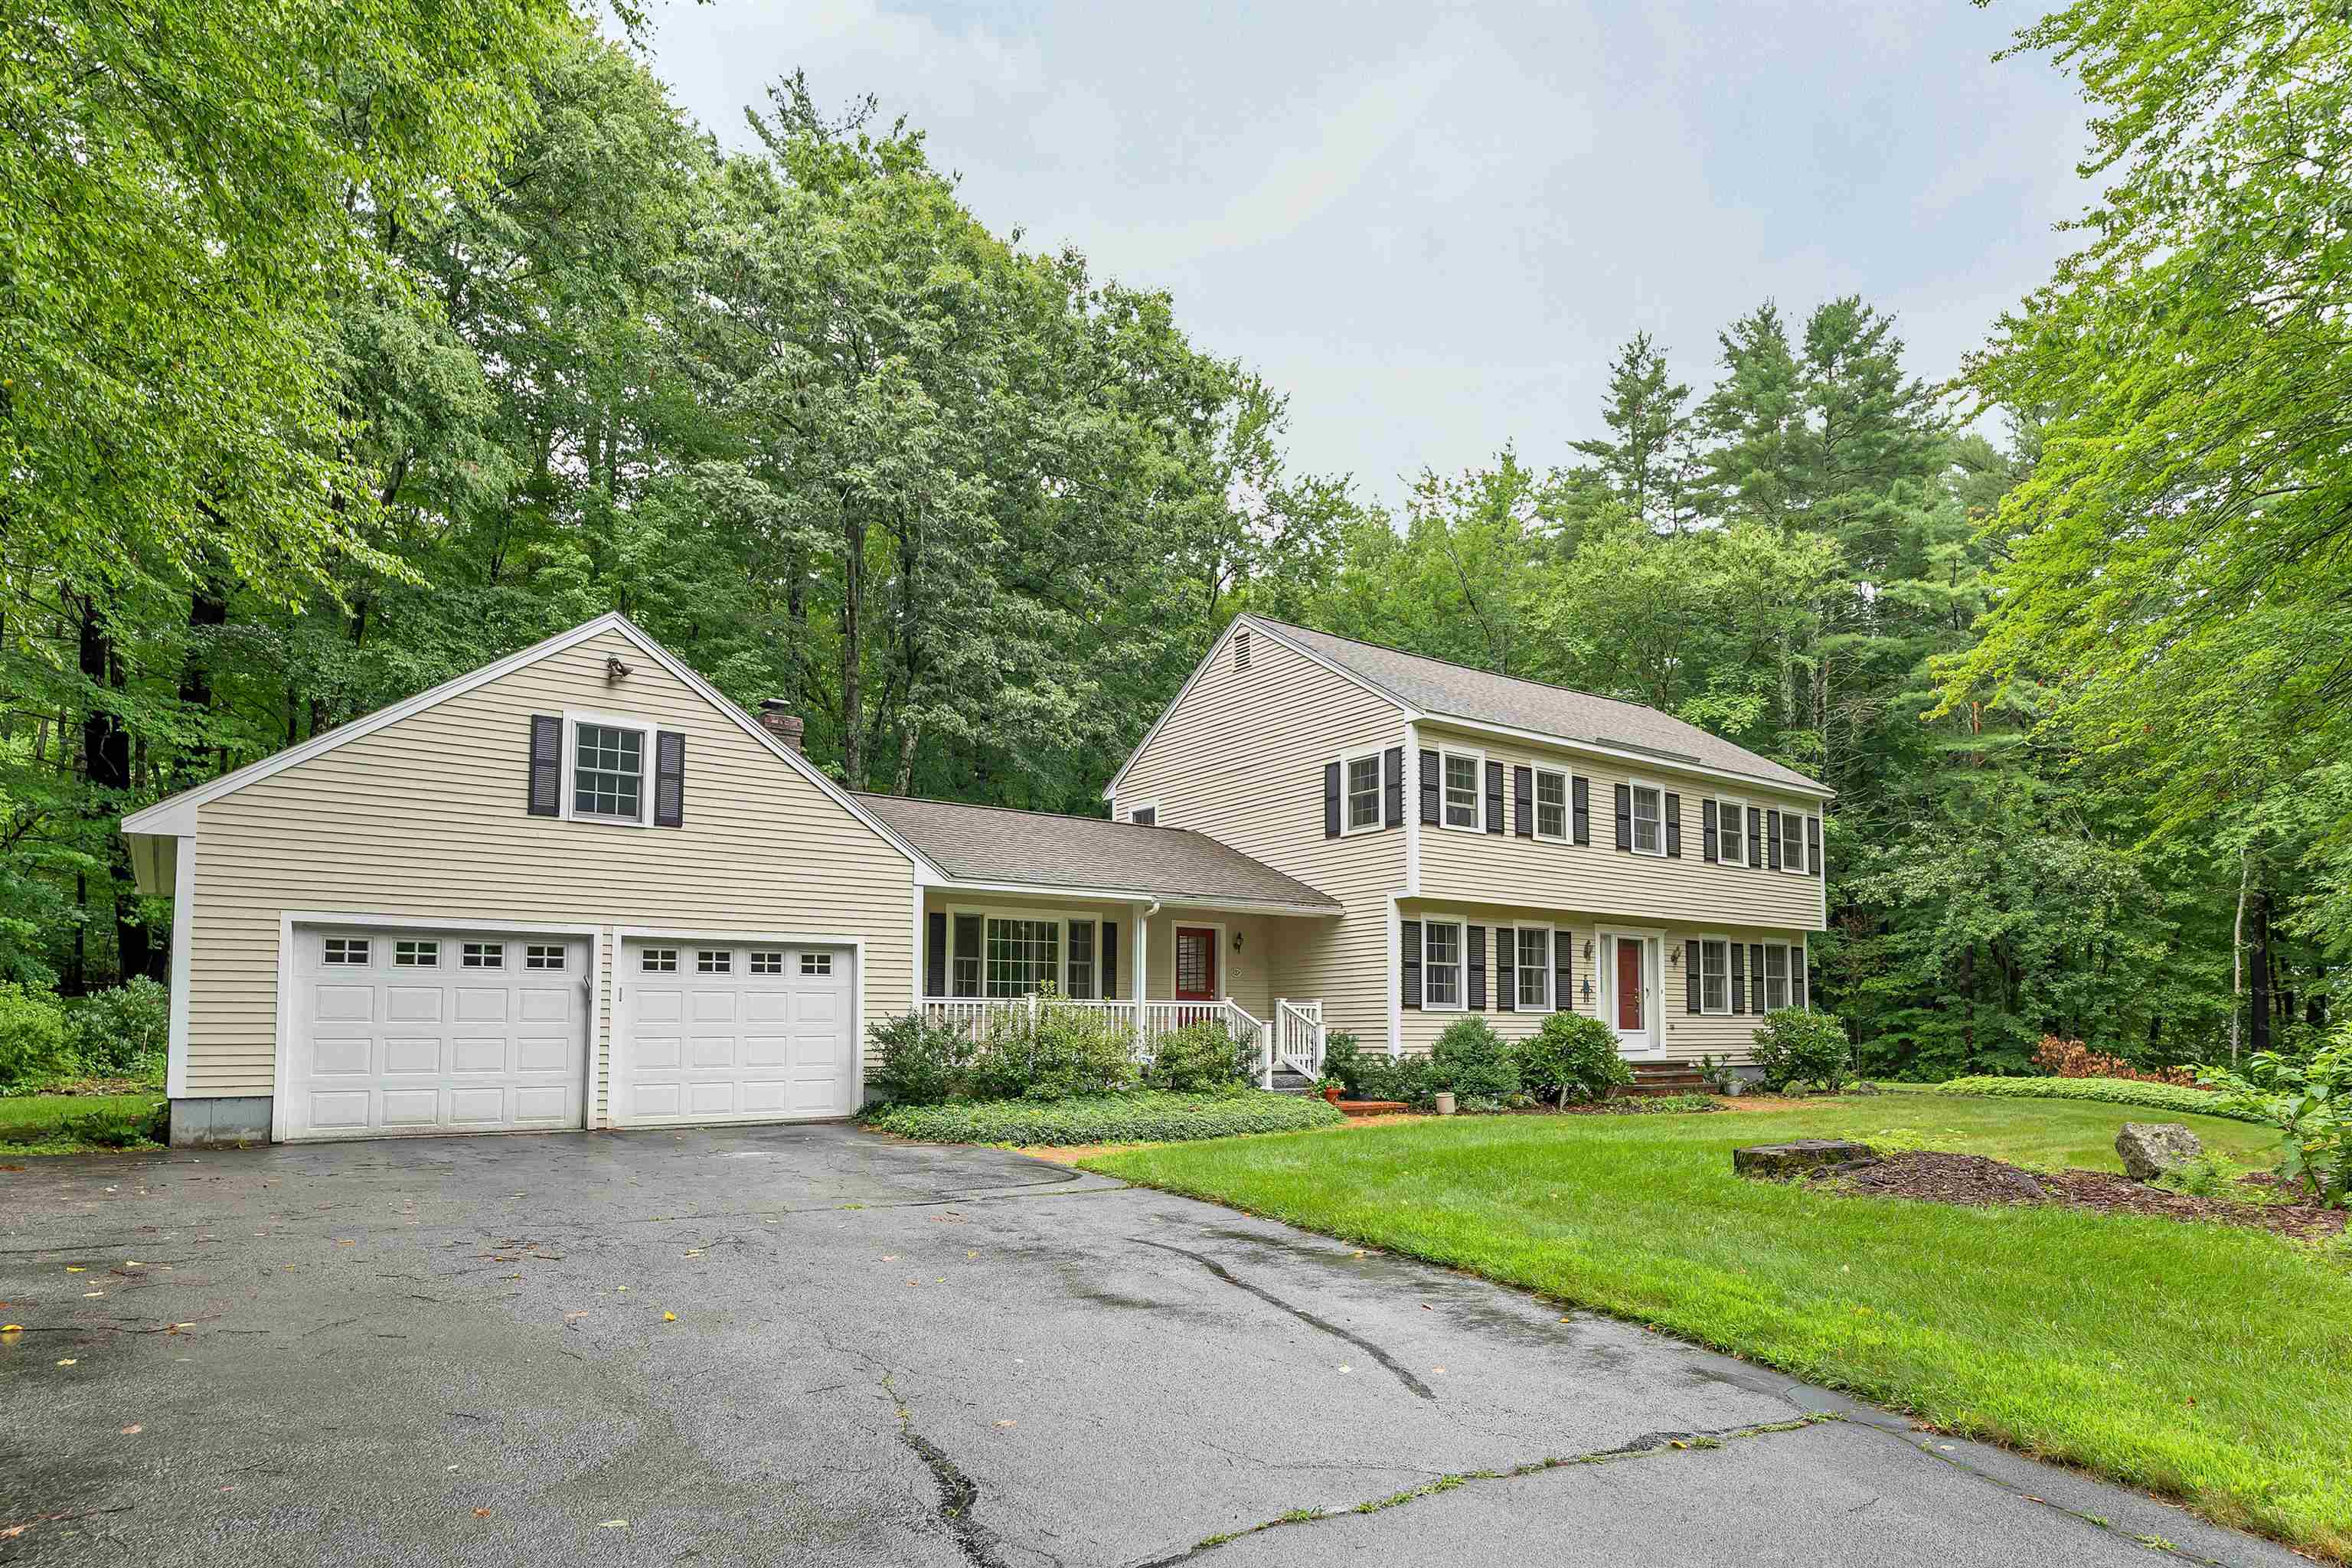
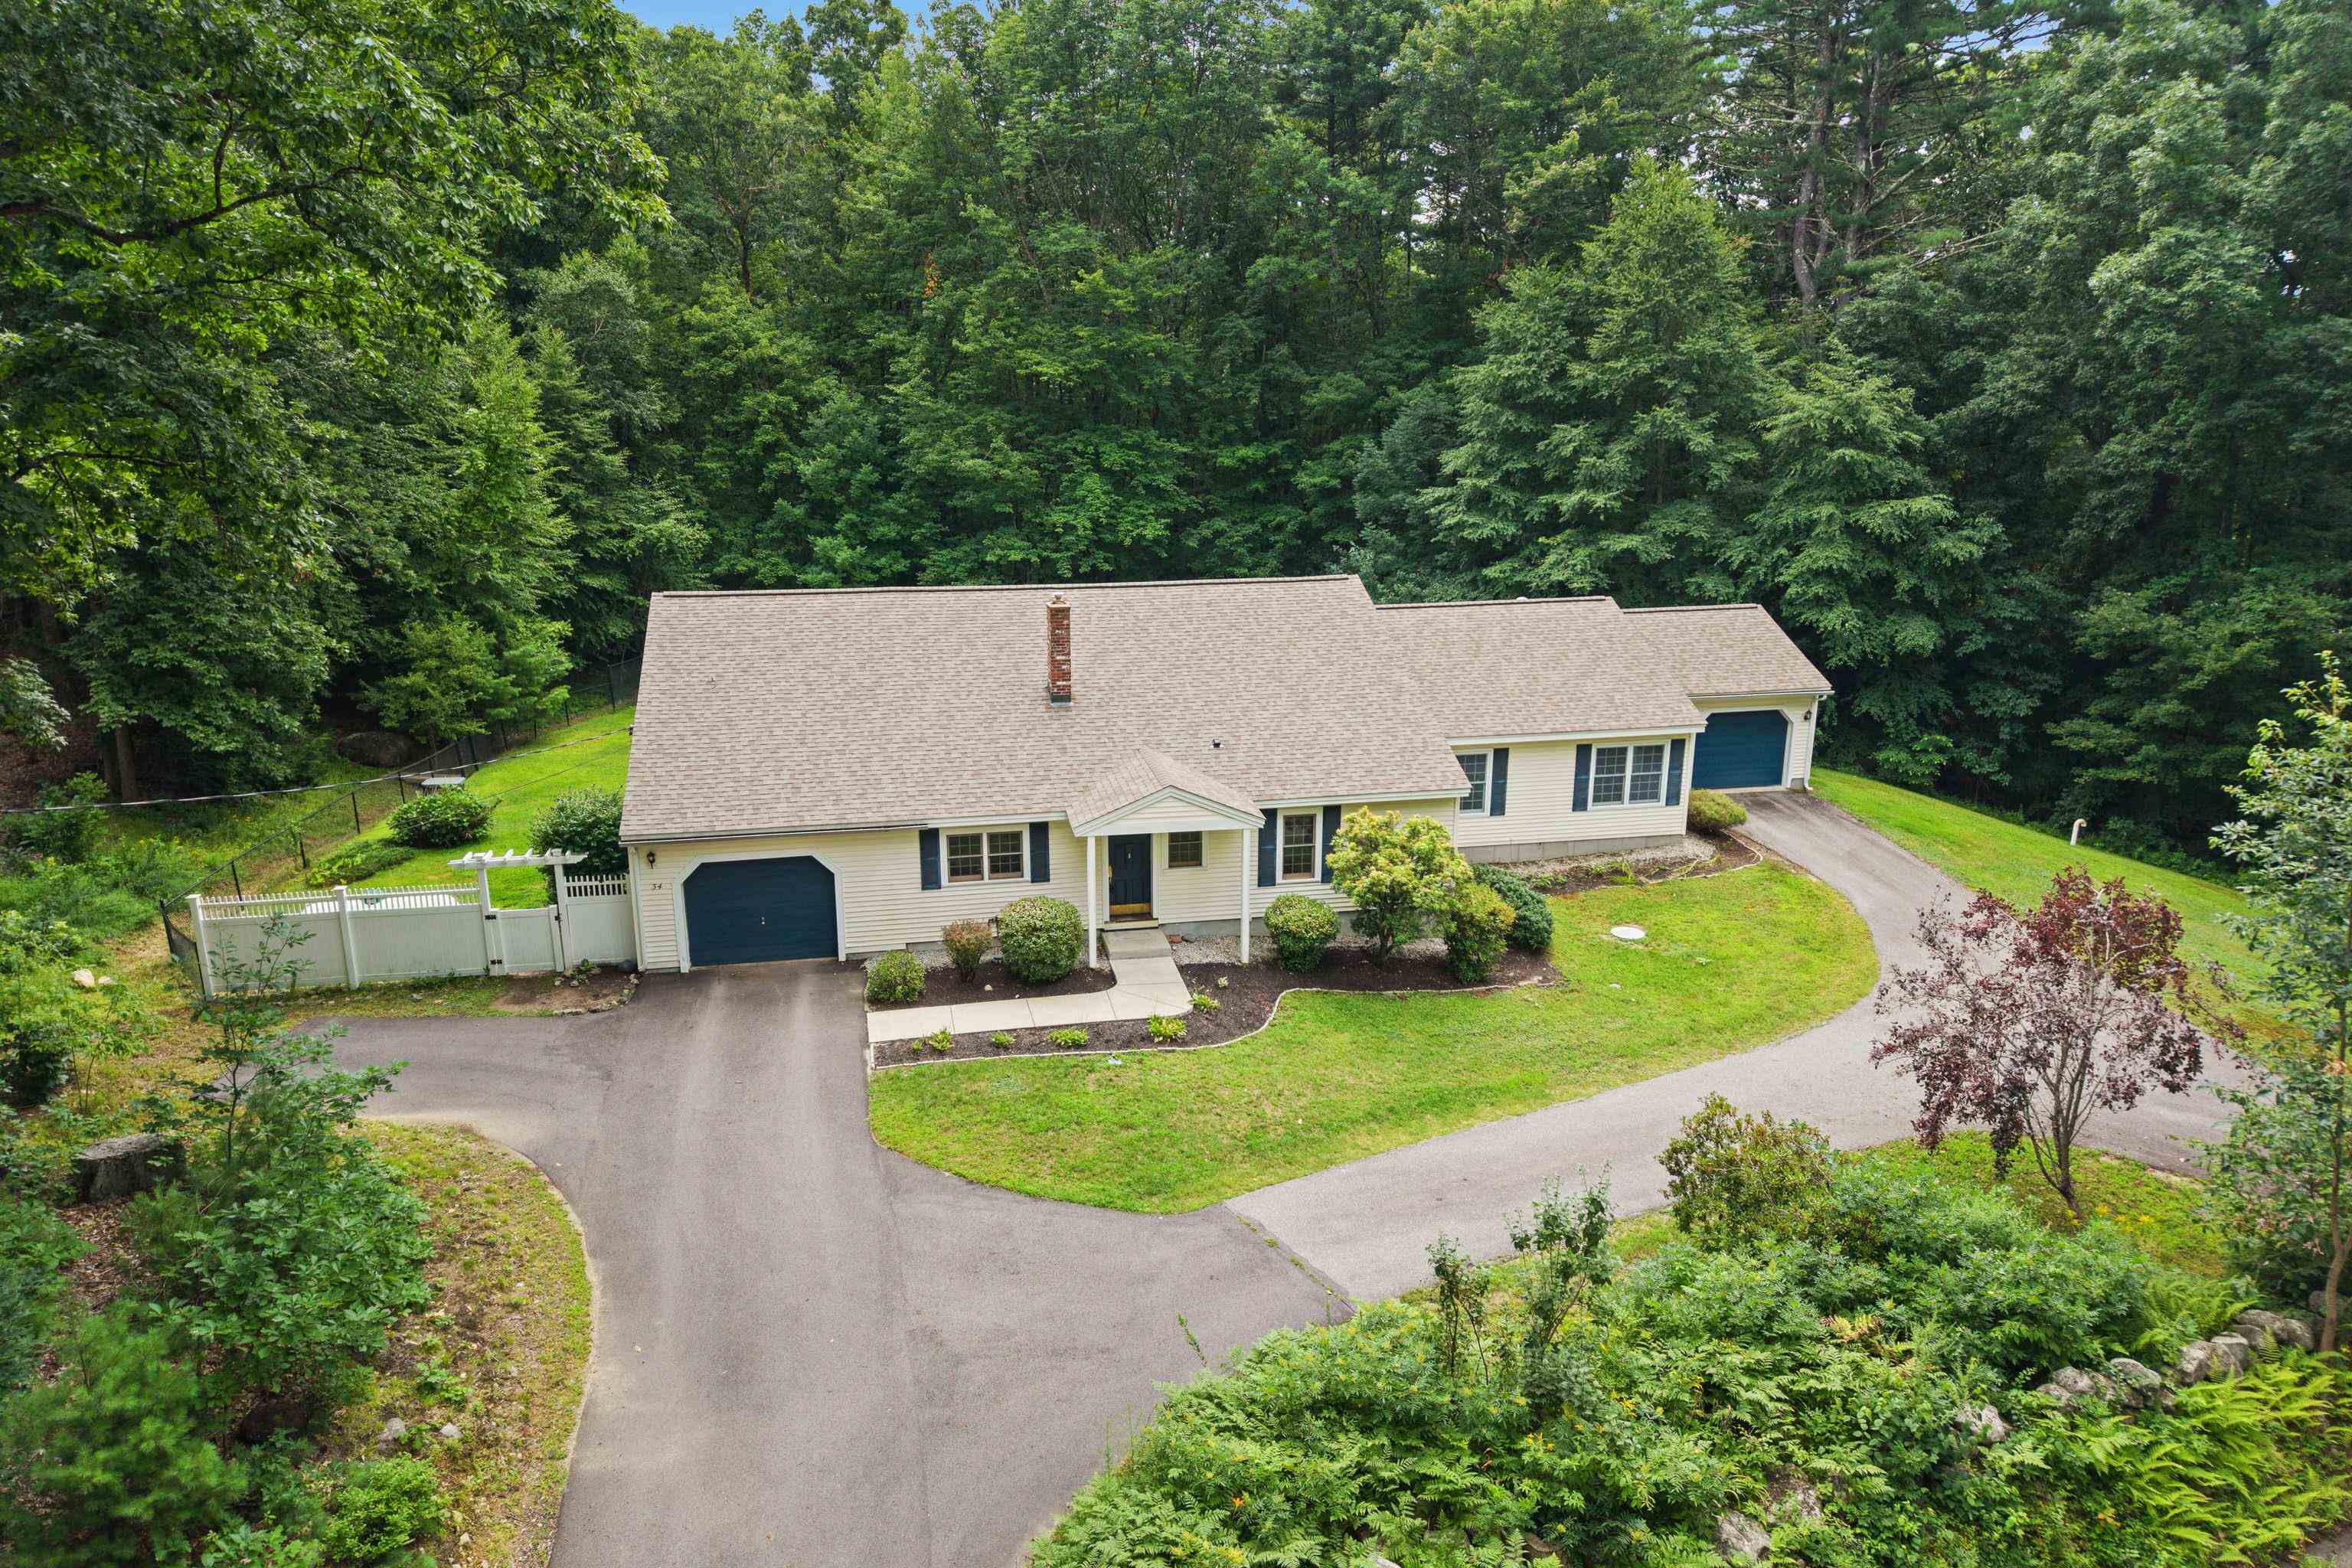
Both markets include antique homes, Colonials, Capes, Contemporary houses, subdivisions, condominiums, and newer construction. Bedford's active single-family asking median was higher in the current snapshots, but price does not control for age, size, acreage, renovation, road setting, or utility type. Compare relevant closed sales and inspect each property.
Bedford showed tighter supply at 1.8 months, while Amherst showed 3.6 months. Amherst's median sale-to-original-list ratio was above 100%; Bedford's was just below. These town-level figures can mask major variation among price bands and property types.
Explore the full Bedford guide and Amherst guide for methodology and property-level considerations.
Do not compare New Hampshire towns on tax rate alone. The tax bill depends on assessed value and the applicable rate, and revaluation timing matters. Use the current bill for each property, review the assessing record, and confirm changes with the municipality.
Private wells and septic systems are common considerations in both towns, but utility arrangements vary by parcel and corridor. Bedford also has sewer service in portions of town; Amherst has limited special utility arrangements, including a community septic system near Baboosic Lake. Obtain records and inspect the actual systems serving the property.
Build the choice from specific needs that can be verified:
Bedford's July 31, 2026 single-family median asking price was $999,000, compared with $839,900 in Amherst. The difference does not adjust for the mix of homes listed in each town.
The listing counts were similar, but Amherst had 3.6 months of supply compared with Bedford's 1.8 months. Inventory changes continuously.
Bedford directly borders Manchester. Actual travel time depends on the address, destination, route, weather, and traffic.
Review Bedford listings and Amherst listings, then compare total cost and property-level conditions.
Sources: HouseCanary Market Insights for ZIP codes 03110 and 03031, statistics through July 31, 2026; official Bedford and Amherst municipal planning resources. Market figures may be revised.
Equal Housing Opportunity. This objective comparison does not rank communities or characterize residents. Verify all material facts independently.